Key statistics at a glance
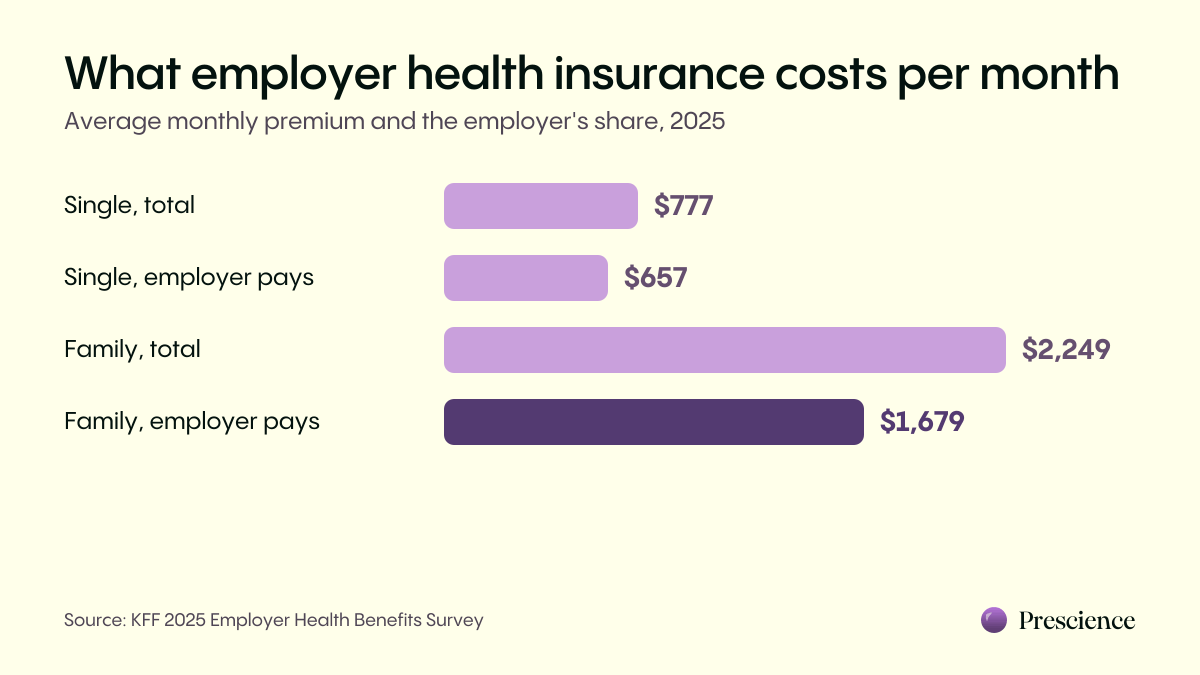
- $26,993: average annual family premium for employer coverage, 2025 (KFF).
- $9,325: average annual single premium, 2025 (KFF).
- $6,850: what the average worker pays toward family coverage each year; $8,889 at small firms (KFF).
- $1,886: 2025 single deductible among workers with a general deductible; $2,631 at firms with 10–199 workers (KFF).
- 59%: share of firms with 10–199 workers offering health benefits, vs. 97% of larger firms (KFF).
- 53.8%: share of Americans with employment-based coverage in 2024 (Census).
- 9.0%: PwC's projected group medical cost trend for 2027.
Premiums in 2025
| Group | Single | Family |
|---|---|---|
| All covered workers | $9,325 | $26,993 |
| Firms with 10–199 workers | $9,211 | $26,054 |
| Firms with 200+ workers | $9,361 | $27,280 |
| PPO plans | $9,818 | $28,272 |
| High-deductible plans with a savings option | $8,620 | $25,379 |
| Firms where 35%+ of workers are 50 or older | $9,599 | $27,699 |
| Firms where 35%+ of workers earn $80,000+ | $9,600 | $27,957 |
KFF reports similar single premiums across firm sizes but lower family premiums at small firms in this survey. These are weighted averages of covered workers, not quotes for an otherwise identical group. Network, benefit design and enrollment mix differ across categories.
Premiums over time
| Year | Single | Family | Family growth that year |
|---|---|---|---|
| 2015 | $6,251 | $17,545 | 4% |
| 2020 | $7,470 | $21,342 | 4% |
| 2024 | $8,951 | $25,572 | 7% |
| 2025 | $9,325 | $26,993 | 6% |
- KFF's 2025 report puts five-year family premium growth at 26%, compared with 28.6% wage growth and 23.5% inflation.
- It reports ten-year family premium growth of 53%, compared with 35.8% inflation.
- Do not recompute those trend percentages by dividing the original older reports in the table. KFF adjusts historical comparisons to the 2025 survey population of firms with at least ten workers.
- Keep both the survey year and population definition with any chart copied into a budget presentation. Rounded figures also need not reproduce every published percentage exactly.
What workers pay
| Measure | All firms | Small firms (10–199) | Large firms (200+) |
|---|---|---|---|
| Share of family premium paid by worker | 26% | 36% | 23% |
| Family contribution per year | $6,850 | $8,889 | $6,227 |
| Covered workers paying $12,000+ for family coverage | 11% | 28% | n/a |
| Covered workers whose employer pays full single premium | n/a | 29% | 7% |
| Worker pays over half the family premium | n/a | 29% | 5% |
Across all firms, workers contribute 16% of single premiums ($1,440 a year) and 26% of family premiums ($6,850). Small firms split the extremes: they're more likely to pay all of the single premium and more likely to leave families paying most of theirs.
Deductibles, out-of-pocket limits and plan types
| Measure | Figure |
|---|---|
| Average general deductible | $1,886 |
| At small firms (10–199) | $2,631 |
| At large firms (200+) | $1,670 |
| Growth over 5 years / 10 years | +17% / +43% |
| Covered workers with a deductible of $2,000+ | 34% (53% at small firms, 28% at large) |
| Out-of-pocket limit of $2,000 or less | 12% of covered workers in plans with an out-of-pocket maximum |
| Out-of-pocket limit above $6,000 | 21% of covered workers in plans with an out-of-pocket maximum |
| Plan type | Share of covered workers |
|---|---|
| PPO | 46% |
| High-deductible plan with savings option | 33% |
| HMO | 12% |
| POS | 9% |
| Conventional (indemnity) | under 1% |
Who offers coverage, by firm size
| Firm size | Offer rate |
|---|---|
| 10–24 workers | 51% |
| 25–49 workers | 64% |
| 50–199 workers | 89% |
| All 10–199 | 59% |
| 200–999 workers | 96% |
| 1,000+ workers | over 99% |
| All firms with 10+ workers | 61% (65% in 2024) |
Offer rates describe firms that offer coverage to at least some workers, not universal enrollment. They do not tell you whether a particular employee is eligible, can afford the contribution or uses another source of coverage. Do not combine firm-level offer rates with establishment-level measures from other surveys without checking definitions and the underlying year.
How many people have employer coverage
- 53.8% of Americans had employment-based coverage for some or all of 2024, the most common type, ahead of Medicare (19.1%), Medicaid (17.6%) and direct-purchase coverage (10.7%) (Census).
- 8.0% lacked health insurance throughout 2024 in the Census CPS ASEC measure. That annual measure is different from being uninsured on a particular day.
- At firms that offer coverage, 80% of workers are eligible, 76% of those eligible enroll, and 61% of all workers end up covered (KFF, 2025).
- Across all firms, 55% of workers are covered by their own employer's plan, down from 57% a year earlier (KFF).
- 91% of workers are employed by a firm that offers coverage to at least some workers (KFF).
Who enrolls when coverage is offered
At offering firms where at least 35% of workers were age 26 or younger, KFF found 39% of workers covered by their employer, versus 64% at other offering firms. At firms where at least 35% earned $37,000 or less, the comparison was 43% versus 64%. These associations do not prove why workers declined coverage or predict enrollment at a particular startup.
Among offering firms, reported own-employer coverage was 72% for public-sector workers, 59% at private for-profit firms and 60% at nonprofits. These figures should not be presented as coverage rates for all workers in each sector, including firms that offer no health benefits.
The numbers that matter most for small businesses
Small-firm averages highlight different contribution and cost-sharing choices. For family coverage, the premium average was $26,054 at firms with 10–199 workers and $27,280 at larger firms, while worker shares averaged 36% and 23%. Do not multiply those average percentages by the average premiums and label the result the published worker dollar contribution.
I would compare a proposed benefit with these benchmarks across several dimensions. A lower employer contribution may leave families paying more even when total premiums are similar. A deductible average alone does not summarize the whole policy. See employer contributions and average premium cost for examples using explicit assumptions.
Funding models
- 67% of covered workers are in self-funded plans; 80% at firms with 200 or more workers.
- At firms with 10–199 workers: 27% self-funded and 37% level-funded.
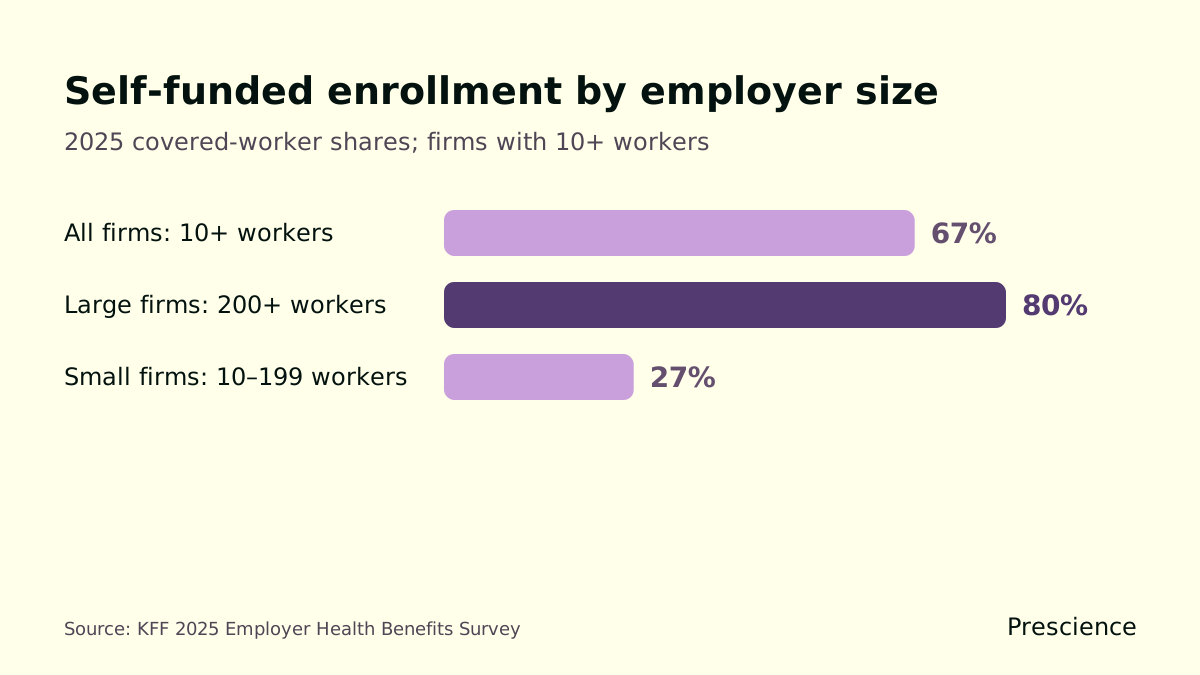
These survey categories overlap. KFF reports 51% of small-firm covered workers in either a level-funded or self-insured plan; adding 27% and 37% to get 64% would be wrong. Its questions account for respondents who describe level-funded coverage as insured or self-funded. The legal funding arrangement and the respondent's label are not always identical.
The funding shares do not establish that self-funding causes lower deductibles. Employers select their benefit designs separately, and the survey does not isolate a causal effect of financing on employee cost sharing. Compare the actual deductible, copays and maximum in each proposal.
GLP-1 coverage
| Firm size | Cover for weight loss |
|---|---|
| 200–999 workers | 16% |
| 1,000–4,999 workers | 30% |
| 5,000+ workers | 43% (28% in 2024) |
- Among firms with at least 5,000 workers that covered these medicines for weight loss, 59% reported use above expectations and 66% reported a significant effect on prescription-drug spending. Those percentages do not describe all large employers.
- Coverage depends on the exact drug, indication and policy. A diabetes benefit does not establish obesity-treatment coverage. See GLP-1 coverage decisions.
The individual market (relevant to ICHRA)
- Individual-market data describe a different market from employer coverage. Check plan availability by employee location before evaluating an ICHRA.
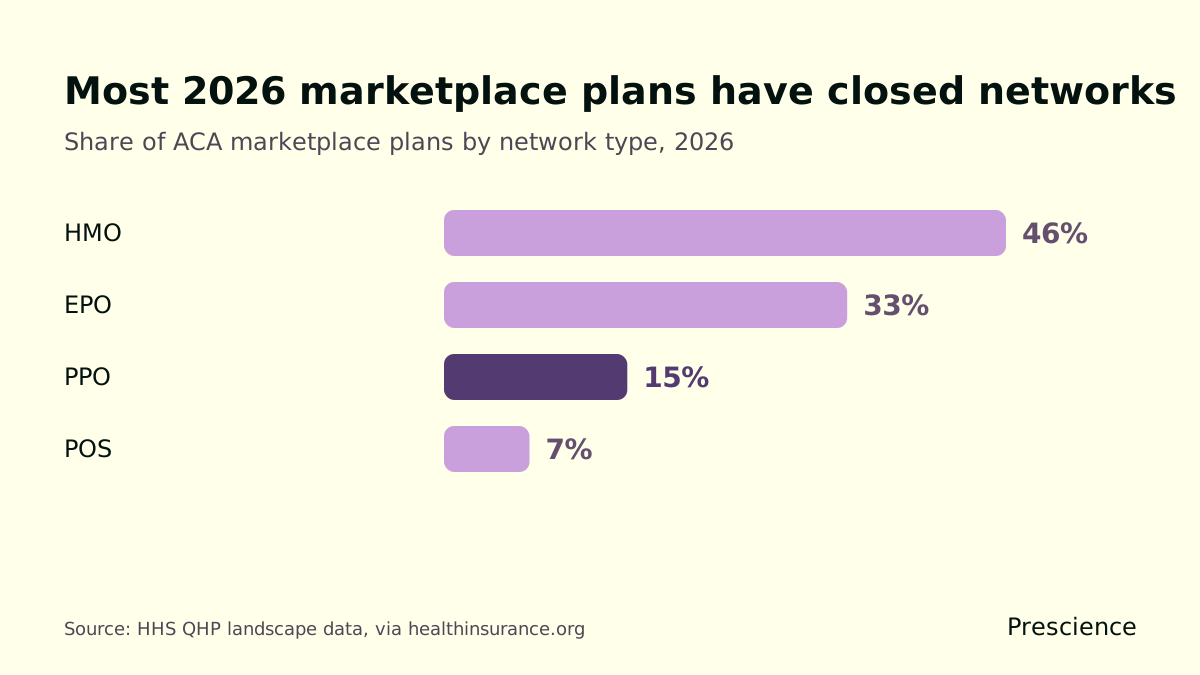
- A plan-count network share is not an enrollment-weighted share of people. Neither establishes whether an employee's doctor participates.
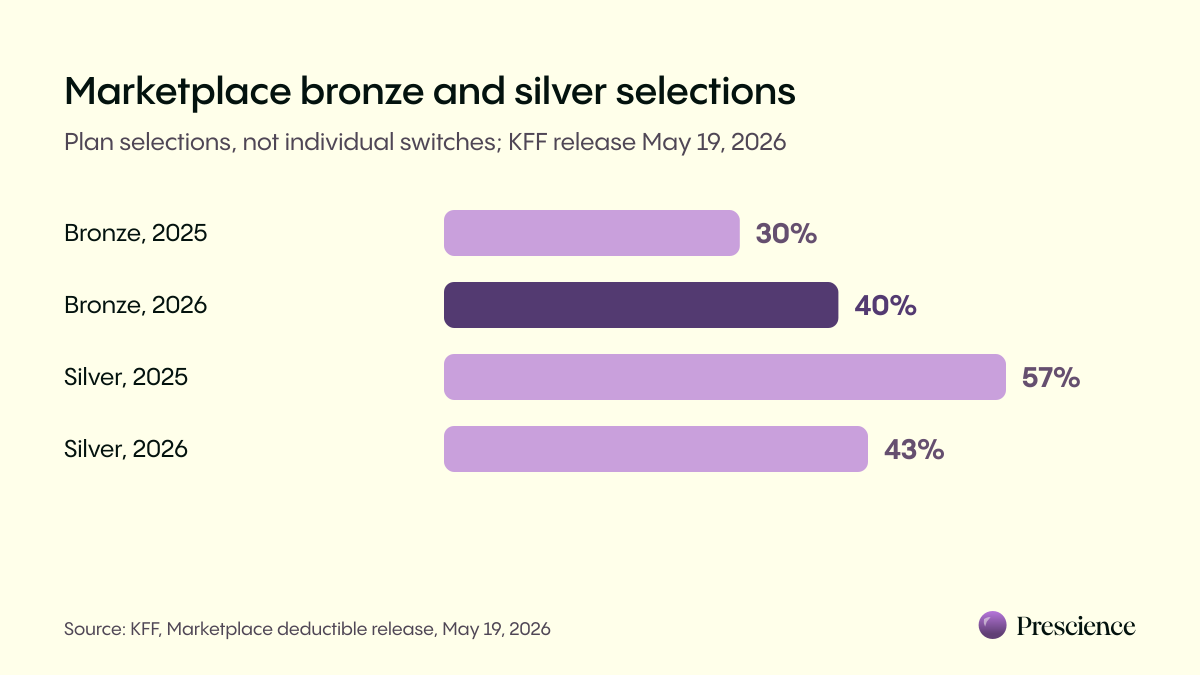
- Compare premium before assistance, premium after assistance and cost sharing separately. A national premium-change percentage cannot determine a specific employee's net cost.
- Marketplace plan counts and employer enrollment measure different things. Do not treat the chart percentages as employee enrollment shares or as a forecast of the plans available in a particular ZIP code. Confirm current choices using CMS files and the actual policies.
Where costs are heading
| Projection | 2026 | 2027 |
|---|---|---|
| PwC group medical cost trend | 9.0% (restated in 2027 report) | 9.0% |
| PwC individual market trend | 8.5% (restated in 2027 report) | 8.5% |
| Mercer employer cost per employee | 6.7% | 8.2% after plan changes (11% with none) |
The September 2026 Marsh release on Mercer's site reports preliminary employer expectations, not realized 2027 spending. PwC's medical trend measures expected cost growth before individual employers' specific benefit decisions. Treat both as scenarios for planning rather than direct renewal forecasts. PwC revised its earlier 2026 group estimate upward from 8.5% to 9.0%.
What the averages mean for a 20-person company
How to read these numbers
- Check the denominator. KFF premium averages weight covered workers, while offer rates describe firms. Neither is automatically an average over every employee in the economy.
- The 2025 KFF survey excludes firms with 3–9 workers, so it says little about the smallest companies.
- Keep household and employer surveys separate. Census counts people and coverage during the year; KFF surveys employers. People may have more than one coverage type, so Census percentages need not sum to 100%.
- Projections are not renewals. PwC and Mercer describe market averages. Your renewal also depends on aging, plan changes and how your plan is priced. See why did our health insurance renewal go up.
Turn statistics into a decision without overstating them
I start a comparison by writing down the question. A company setting its premium contribution needs contribution and enrollment data. A family choosing a plan needs covered service costs, annual payroll deductions and the relevant maximum. A chart about the percentage of employers offering benefits does not answer either question on its own. Select the measure that matches the decision before choosing a statistic because its number looks compelling.
For a budget, make a column for measured facts and another for assumptions. Put the survey year next to every external number. Replace provisional premiums with written quotes when they arrive, and preserve the original census so you can explain any difference. Keep scenarios for family enrollment separate from scenarios for premium growth. That allows a reviewer to see whether the company is buying richer benefits, covering more people or paying more for comparable coverage.
For a presentation, retain uncertainty and definitions even when shortening the slide. Do not label the small-firm deductible as what every employee pays, or the national employer premium as the employee payroll deduction. Avoid ranking individual insurers from employer-level averages. The strongest use of these statistics is to identify questions for the actual proposal, then document the answers from the policy and quote.